This being President Obama's last week the right wing media which boasts the majority of American media, especially talk radio has been apoplectic in trying to destroy the presidents legacy which has been free of personal scandal and no really bad political scandals that they could come up with. This includes trying hard to talk about how horrible the economy really is compared to what Obama is stating. These same people said the horrendous Bush Depression wasn't so bad at the time he left office and they have been trying to blame it on Clinton and his repeal of the Glass Stiegel Act which was actually a bill put forth by Republicans, same as NAFTA and all other awful trade bills. And don't forget Obama was born in Kenya, he is a gay pothead who was schooled by an anarchist and he married a tranny named Michelle. Never mind he beat Hillary Clinton who was forced to run a child prostitution ring in the basement of a pizza parlor for her four years after she left the state department. I can't wait to see what they or Trump come up with this last week.***************************************************************************************************
Obama’s Final NumbersStatistical indicators of President Obama's eight years in office.
By Brooks Jackson
Posted on September 29, 2017 | Updated on May 17, 2018
The numbers are nearly all in now. What they show about what really happened during the eight years that Barack Obama was president is sometimes different from what politicians claimed.
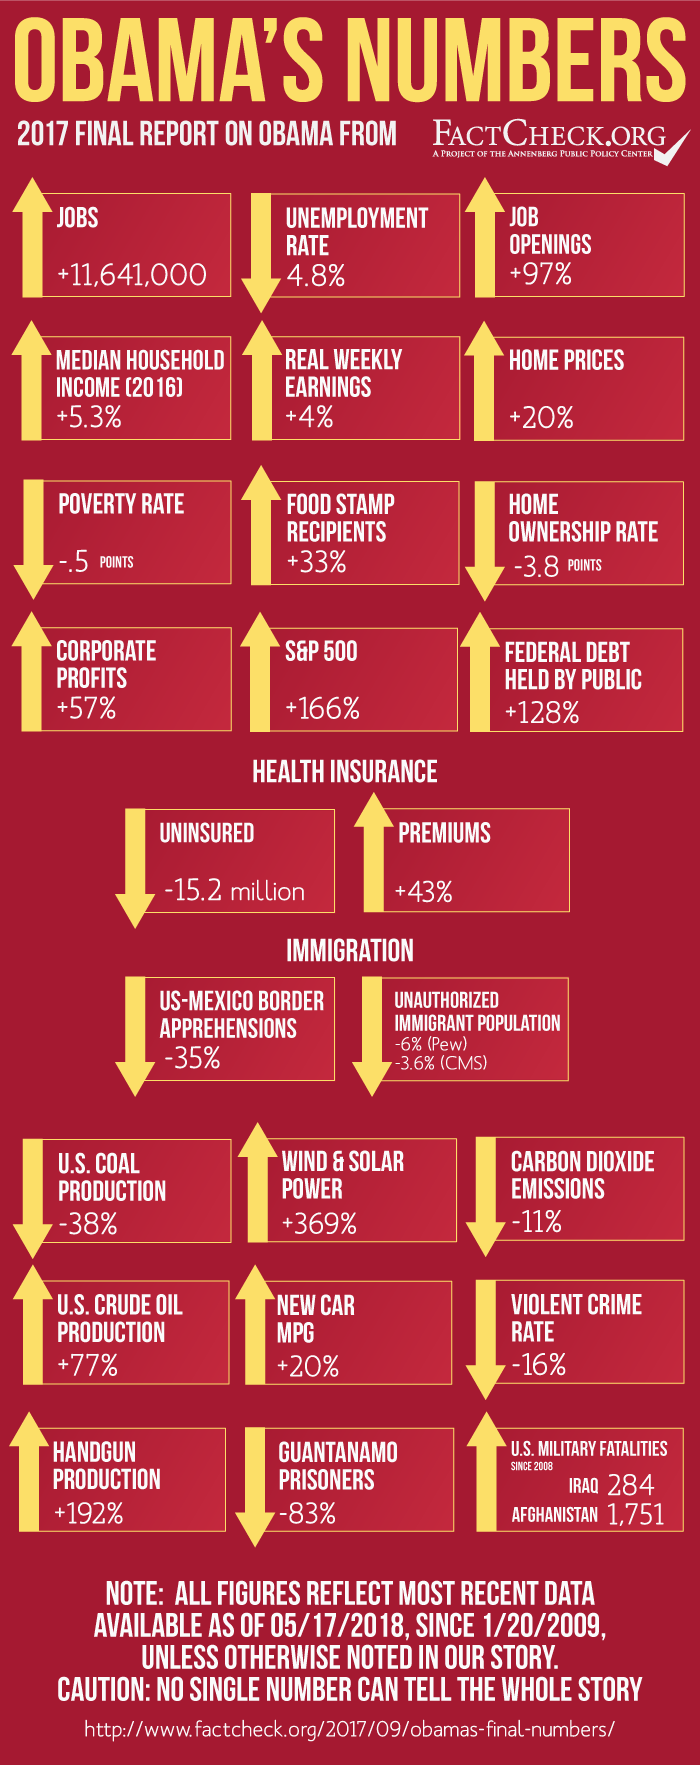
The economy gained a net 11.6 million jobs. The unemployment rate dropped to below the historical norm.
Average weekly earnings for all workers were up 4.0 percent after inflation. The gain was 3.7 percent for just production and nonsupervisory employees.
After-tax corporate profits also set records, as did stock prices. The S&P 500 index rose 166 percent.
The number of people lacking health insurance dropped by 15 million. Premiums rose, but more slowly than before.
The federal debt owed to the public rose 128 percent. Deficits were rising as Obama departed.
Home prices rose 20 percent. But the home ownership rate hit the lowest point in half a century.
Illegal immigration declined: The Border Patrol caught 35 percent fewer people trying to get into the U.S. from Mexico.
Wind and solar power increased 369 percent. Coal production declined 38 percent. Carbon emissions from burning fossil fuel dropped 11 percent.
Production of handguns rose 192 percent, to a record level.
The murder rate dropped to the lowest on record in 2014, then rose and finished at about the same rate as when Obama took office.
Analysis
Gathering statistics is a painstaking and time-consuming job. Figures on crime, household incomes and poverty in 2016 weren’t released until September 2017, for example.
But now we have a reasonably complete statistical picture of the Obama years, which began in the middle of the worst economic downturn since the Great Depression, and ended with the highest level of household income ever recorded.
These facts often turn out to be at odds with the impressions created by candidates who, for example, claimed wages and incomes were stagnant when in fact they were rising. The facts also can conflict with impressions created by news media reporting dramatic but untypical events. Despite nonstop coverage of several mass shootings, for example, the murder rate was going down for most of the Obama years, hitting the lowest ever recorded in 2014.
Some of these figures remain subject to tweaks and revisions. Figures on handgun production in 2016 are still “preliminary,” for example, and others will remain subject to slight revisions for years to come, as statisticians routinely refine their methods and assumptions. We will keep this update current as necessary in the months and years to come. For now, it’s as “final” as possible.
Update, Feb. 14, 2018: We updated this article and its graphics to reflect that the Bureau of Labor Statistics’ annual “benchmarking” revisions added more than 150,000 jobs to its previously reported figure for January 2017, bringing the total added under Obama to more than 11.6 million (up from 11.5 million), an 8.7 percent increase (up from 8.6 percent).
We also updated a graphic in the “Immigration” section to reflect that the U.S. Border Patrol revised its figures on people caught while illegally trying to cross the U.S.-Mexico border upward by four for calendar year 2016.
Jobs and Unemployment
Jobs — Over Obama’s eight years in office, the economy added a net total of more than 11.6 million jobs — a gain in total nonfarm employment of 8.7 percent, according to the Bureau of Labor Statistics.
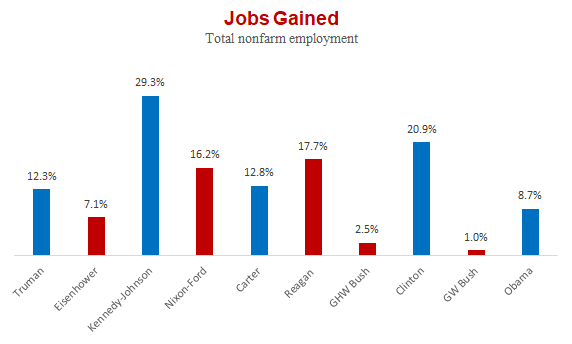
That percentage gain is not as large as for most other administrations since the end of World War II.
In fact, the only other post-war administrations to see smaller gains in employment were those of Obama’s predecessor, George W. Bush, who eked out a bare 1 percent gain, Dwight D. Eisenhower (7.1 percent in his eight years), and Bush’s father, George H.W. Bush (2.5 percent during his four years).
Jimmy Carter saw a much stronger employment gain — 12.8 percent — despite the fact that his administration lasted only four years, half as long as Obama’s.
Note: For these historical comparisons, we’ve begun with the inauguration of Harry Truman in 1949, when he became the first president elected after the end of World War II. For simplicity, we’ve combined the administrations of Democrats John F. Kennedy and his successor, Lyndon B. Johnson (who took office after Kennedy was assassinated), and of Republicans Richard Nixon and his successor, Gerald Ford (who served out the remainder of Nixon’s second term after Nixon resigned), as though each were single eight-year administrations.
In our graphics, we show Republican administrations in red, Democratic administrations in blue.
Obama had the unique disadvantage of taking office in the midst of the worst financial crisis since the Great Depression. More than 4 million jobs were lost in his first year in office, on top of the 4 million lost in George W. Bush’s final year.
To be sure, Bush’s eight years were marked by two recessions, including one that began two months after he took office in 2001. That helps explain why job creation on his watch was by far the worst of any post-war administration.
Both Bush and Obama also were bucking strong demographic trends. The surging percentages of women entering the job market, which started in the 1960s, peaked at the end of the Clinton administration. Also, “baby boomers” — those born in the years after WWII veterans returned from the war to take up family life — reached retirement age in great numbers during Obama’s time.
Labor Force Participation — Because of these and other factors, relatively fewer people said they wanted to work. Under Obama, the labor force — those either working or actively looking for a job — slipped from 65.7 percent of those age 16 and older to 62.9 percent.
Job Openings — With relatively fewer people seeking employment, a job shortage changed to a worker shortage under Obama. The Department of Labor reported that the number of unfilled job openings nearly doubled during Obama’s time, hitting just under 6 million in July 2016. That was at the time the highest in the more than 16 years that Labor Department statisticians had tracked this number.
Before Obama’s tenure, the only time job openings topped 5 million was January 2001. During Obama’s second term, there were 25 months with over 5 million openings. It has since continued to rise, topping 6 million for the first time in April 2017, under President Donald Trump.
Unemployment — The unemployment rate was high when Obama took office — 7.8 percent — and it continued to get worse in his first year. It peaked at 10 percent in October 2009 and didn’t drop below 9 percent until two years after that.
But slowly, and more or less steadily, the rate improved. By the time Obama left office, the jobless rate had dropped 3 full percentage points, an improvement exceeded only by the slightly bigger declines during the Clinton and Kennedy-Johnson administrations.
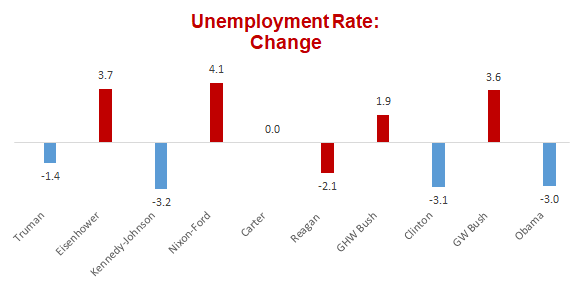
By the time Obama left office, the jobless rate was down to 4.8 percent — well below the historical norm of 5.6 percent (the median rate for all the months since Truman’s inauguration in January 1949).
But getting down to that point was a long, slow grind. So slow that over all of Obama’s 96 months in office, the median jobless rate was 7.7 percent — the highest for any administration since the end of World War II.
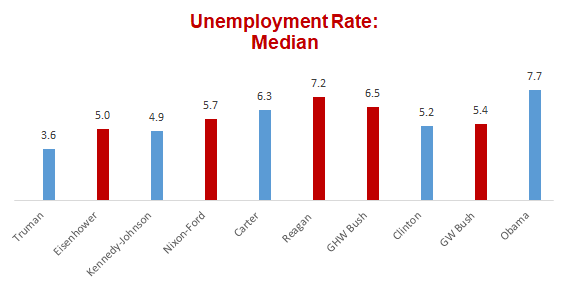
Obama’s experience is similar to that of Ronald Reagan — who presided over the second highest median jobless rate, 7.2 percent.
In Reagan’s first term, unemployment peaked at 10.8 percent — higher than Obama’s 10 percent peak. And under Reagan, it stayed at or above 10 percent for 10 straight months starting in September 1982 — compared with Obama’s one-month high of 10 percent.
Like Obama, Reagan also saw the rate decline steadily after the worst was over.
By the time Reagan left office in January 1989, the rate was down to 5.4 percent, not far above Obama’s final month at 4.8 percent.
Both Obama and Reagan left office with job approval ratings above 50 percent.
Income and Poverty
The inflation-adjusted incomes of American households reached the highest level ever recorded under Obama. The Census Bureau’s measure of median household income reached $59,039 in 2016. That was $2,963 more in “real” (inflation-adjusted) dollars than in 2008, for an overall gain of 5.3 percent.
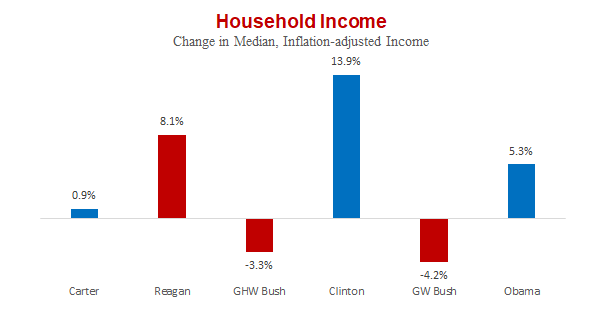
The median figure represents the midpoint — half of all households earned more, half less. And while real median income hit a record level in Obama’s final year, it was a long, rough road to the top.
In fact, the 5.3 percent gain under Obama barely made up for the 4.2 percent loss under his predecessor. And for his first six years in office, median income was below the level in 2008.
Obama’s 5.3 percent gain was less than the 13.9 percent gain under Bill Clinton, and the 8.1 percent gain under Reagan. It is also pushed up to a degree by a change in the Census Bureau’s survey questions in 2014, designed to correct for under-reporting of certain types of income in previous years.
The trend to higher incomes also shows up in the Bureau of Labor Statistics’ monthly report on average weekly earnings for all workers, adjusted for inflation. That figure, which includes salaried managers and supervisors, was 4.0 percent higher in the month Obama left office than it was in the month he first entered the White House. It was 3.7 percent higher for just production and nonsupervisory employees.
As incomes rose, the rate of poverty declined. The percentage of Americans living with income below the official poverty line went down to 12.7 percent of the population in 2016, a half-point drop compared with 2008.
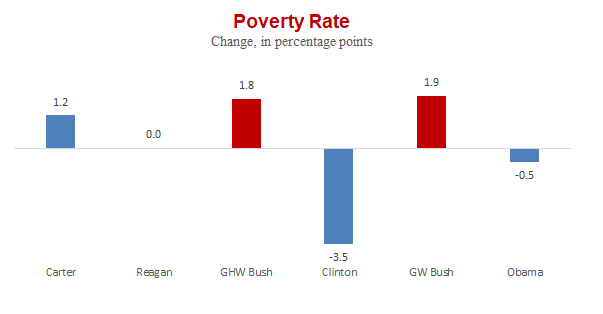
That decline also wasn’t nearly enough to reverse the 1.9 percentage point rise in poverty under George W. Bush, and it was far less than the 3.5 percentage point decline under Clinton.
And even though the rate of poverty went down under Obama, the number of people in poverty rose — just not as fast as the population in general. In 2016, just over 40.6 million Americans were still living below the poverty line, an increase of 787,000 people compared with 2008. Under George W. Bush, the number went up by more than 8 million, after going down by more than 6 million under Clinton.
Home Prices
Home values rebounded under Obama, reaching a new high in his final year.
Sales figures from the National Association of Realtors show the national median price of an existing, single-family home was $235,500 in 2016. That was $38,900 higher than in 2008, an increase of 19.8 percent under Obama.
The 2016 figure was a record, but only in raw dollars, without accounting for inflation. Prices reached their pre-recession high in 2006. In the decade between then and Obama’s final year, home prices rose 6.1 percent, while the Consumer Price Index rose 19 percent.
Home Ownership
The home ownership rate drifted down under Obama, touching the lowest point in more than half a century during his final year.
In the second quarter of 2016, 62.9 percent of households owned their own home, according to Census Bureau figures. That ties the lowest point since the Census Bureau began collecting the figures. The last time the rate was that low was in the third quarter of 1965.
The home ownership rate began its slide after peaking at 69.2 percent in the second quarter of 2004. It already had come down 1.7 percentage points before Obama took office, but it went down by a greater amount in his two terms as president.
In Obama’s last quarter, the rate rebounded to 63.7 percent, as the economy improved and sales of new and existing homes hit their best pace since before Obama entered office. But the ownership rate was still 3.8 percentage points lower than the quarter before he took office.
Food Stamps
The number of people receiving food aid under the Supplemental Nutrition Assistance Program (formerly known as “food stamps”) rose by a third under Obama.
In Obama’s last month in office, there were just under 42.7 million Americans receiving SNAP assistance, a gain of 10.7 million or just under 33.5 percent from January 2009.
The number grew as the 2007-2009 recession threw millions out of work, as benefit levels were boosted for several years by the stimulus legislation Obama signed in 2009. The average benefit per person went up from around $113 per person in January 2009 to around $134 in July.
At the peak of food stamp enrollment in December 2012, a total of 47.8 million were receiving aid, an increase of nearly 16 million or 49 percent.
But then millions melted from the rolls as employment and incomes improved, and as Congress cut benefit levels, which dropped to a monthly average of around $124 per person in Obama’s final month.
Measured from his first month to his last, benefit levels and enrollment both grew less under Obama than under his predecessor.
Under George W. Bush, the number of people getting food stamps grew by 14.7 million, or 85 percent (compared with the 10.7 million, 33 percent gain under Obama). The average monthly benefit per person grew from $73.89 in the month Bush took office to $113.60 the month he left. That’s a 54 percent increase, compared with the 9 percent gain at the end of Obama’s time in office.
Corporate Profits
Corporations did much better than workers during Obama’s time. Their profits hit several new yearly highs during his tenure.
MUCH MORE ANALYSIS:
www.factcheck.org/2017/09/obamas-final-numbers/