

Post by the Scribe on Jul 24, 2023 23:12:52 GMT
HEATWAVE
Phoenix sees 24th day of triple-digit temperatures
Climate Change Indicators: Heat Waves
This indicator describes trends in multi-day extreme heat events across the United States.
www.epa.gov/climate-indicators/climate-change-indicators-heat-waves
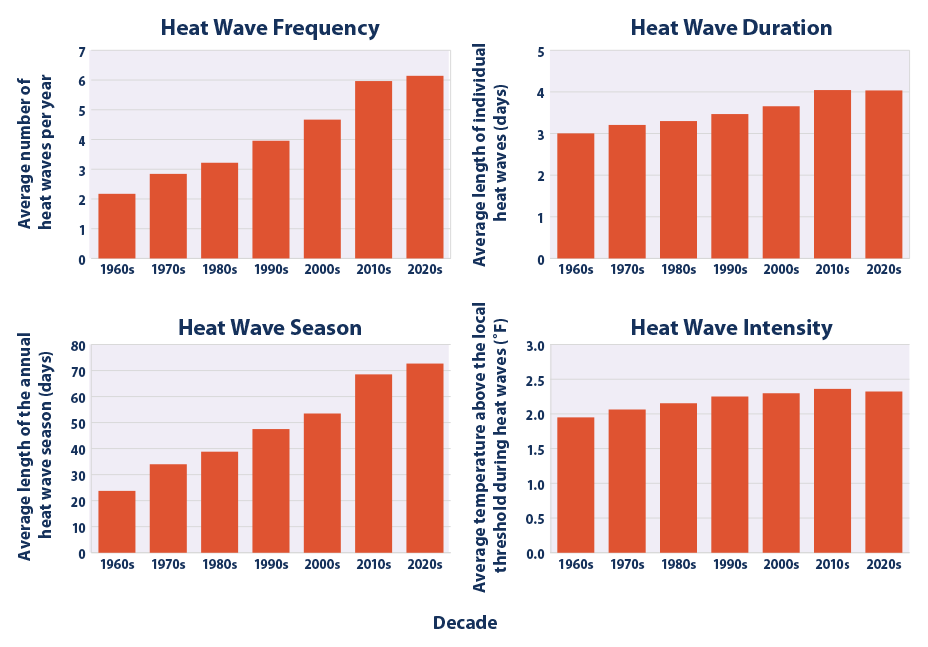
This figure shows changes in the number of heat waves per year (frequency); the average length of heat waves in days (duration); the number of days between the first and last heat wave of the year (season length); and how hot the heat waves were, compared with the local temperature threshold for defining a heat wave (intensity). These data were analyzed from 1961 to 2021 for 50 large metropolitan areas. The graphs show averages across all 50 metropolitan areas by decade.
Data source: NOAA, 20227
Web update: July 2022
Key Points | Background | About the Indicator | About the Data | Technical Documentation
Key Points
Heat waves are occurring more often than they used to in major cities across the United States. Their frequency has increased steadily, from an average of two heat waves per year during the 1960s to six per year during the 2010s and 2020s (see Figure 1).
In recent years, the average heat wave in major U.S. urban areas has been about four days long. This is about a day longer than the average heat wave in the 1960s (see Figure 1).
The average heat wave season across the 50 cities in this indicator is about 49 days longer now than it was in the 1960s (see Figure 1). Timing can matter, as heat waves that occur earlier in the spring or later in the fall can catch people off-guard and increase exposure to the health risks associated with heat waves.
Heat waves have become more intense over time. During the 1960s, the average heat wave across the 50 cities in Figures 1 and 2 was 2.0°F above the local 85th percentile threshold. During the 2020s, the average heat wave has been 2.3°F above the local threshold (see Figure 1).
Of the 50 metropolitan areas in this indicator, 46 experienced a statistically significant increase in heat wave frequency between the 1960s and 2020s. Heat wave duration has increased significantly in 29 of these locations, the length of the heat wave season in 44, and intensity in 17 (see Figure 2).
Longer-term records show that heat waves in the 1930s remain the most severe in recorded U.S. history (see Figure 3). The spike in Figure 3 reflects extreme, persistent heat waves in the Great Plains region during a period known as the “Dust Bowl.” Poor land use practices and many years of intense drought contributed to these heat waves by depleting soil moisture and reducing the moderating effects of evaporation.6
Extreme Weather Grips The Globe As Heatwaves And Wildfires Rage | Climate Change News | News18
CNN-News18
4.47M subscribers
El Nino, fires, global warming gang up to make hottest month on record | DW News
DW News
4.67M subscribers
Phoenix sees 24th day of triple-digit temperatures
Climate Change Indicators: Heat Waves
This indicator describes trends in multi-day extreme heat events across the United States.
www.epa.gov/climate-indicators/climate-change-indicators-heat-waves
This figure shows changes in the number of heat waves per year (frequency); the average length of heat waves in days (duration); the number of days between the first and last heat wave of the year (season length); and how hot the heat waves were, compared with the local temperature threshold for defining a heat wave (intensity). These data were analyzed from 1961 to 2021 for 50 large metropolitan areas. The graphs show averages across all 50 metropolitan areas by decade.
Data source: NOAA, 20227
Web update: July 2022
Key Points | Background | About the Indicator | About the Data | Technical Documentation
Key Points
Heat waves are occurring more often than they used to in major cities across the United States. Their frequency has increased steadily, from an average of two heat waves per year during the 1960s to six per year during the 2010s and 2020s (see Figure 1).
In recent years, the average heat wave in major U.S. urban areas has been about four days long. This is about a day longer than the average heat wave in the 1960s (see Figure 1).
The average heat wave season across the 50 cities in this indicator is about 49 days longer now than it was in the 1960s (see Figure 1). Timing can matter, as heat waves that occur earlier in the spring or later in the fall can catch people off-guard and increase exposure to the health risks associated with heat waves.
Heat waves have become more intense over time. During the 1960s, the average heat wave across the 50 cities in Figures 1 and 2 was 2.0°F above the local 85th percentile threshold. During the 2020s, the average heat wave has been 2.3°F above the local threshold (see Figure 1).
Of the 50 metropolitan areas in this indicator, 46 experienced a statistically significant increase in heat wave frequency between the 1960s and 2020s. Heat wave duration has increased significantly in 29 of these locations, the length of the heat wave season in 44, and intensity in 17 (see Figure 2).
Longer-term records show that heat waves in the 1930s remain the most severe in recorded U.S. history (see Figure 3). The spike in Figure 3 reflects extreme, persistent heat waves in the Great Plains region during a period known as the “Dust Bowl.” Poor land use practices and many years of intense drought contributed to these heat waves by depleting soil moisture and reducing the moderating effects of evaporation.6
Extreme Weather Grips The Globe As Heatwaves And Wildfires Rage | Climate Change News | News18
CNN-News18
4.47M subscribers
El Nino, fires, global warming gang up to make hottest month on record | DW News
DW News
4.67M subscribers